Beyond the Casino Floor:
An Experimental Study of Dice Probability
Writing for Engineers
Michael Duran 10/25
Abstract:
This dice probability experiment involved rolling a pair of six-sided dice 100 times. My primary objective was to record the two numbers obtained and their sum for each trial to answer my question: Which sum is the most probable and occurs most frequently so I can always win ? I hypothesized that the sum of 5 through 7 would be the most frequent outcome.My objective of this experiment was to record and analyze the observed frequencies of sums resulting from 100 rolls. Over the trials, the sums ranged from 2 to 12. The sum of 7 was the most frequent outcome, recorded 21 times. Outcomes of 6 and 8 also occurred frequently.
Introduction:
This lab report presents all the information about probability, which is simply defined as “ the most and least probable outcomes.” According to Mert Yucemoz, University Of Bath The procedure involved 100 trials where I simultaneously rolled a pair of standard, six-sided dice. For every roll, I recorded the two numbers displayed on the dice, followed by their calculated sum. This process generated the necessary dataset for analyzing the probability distribution of two dice.
Materials and Methods:
- A pair of dice
- A pen
- A Notebook to record data using tables
The core method involved 100 rolls. For each trial, the pair of dice was rolled simultaneously. I recorded the resulting number on each individual die and then I’d calculated and logged their sum. Once all 100 trials were complete,I processed the data. I organized the data into a frequency table by counting how many times each sum (2 through 12) appeared. Finally, a bar chart was created from the frequencies to visually analyze the distribution and trends. This rigorous process ensured accurate data for the subsequent analysis.
Results:
| Sum (x) | Tally (Frequency) | Observed Frequency (out of 100) | Theoretical Probability (%) |
| 2 | I | 1 | ≈2.78% |
| 3 | IIII | 4 | ≈5.56% |
| 4 | IIII IIII | 8 | ≈8.33% |
| 5 | IIII IIII I | 9 | ≈11.11% |
| 6 | IIII IIII IIII II | 17 | ≈13.89% |
| 7 | IIII IIII IIII IIII IIII I | 21 | ≈16.67% |
| 8 | IIII IIII IIII IIII | 16 | ≈13.89% |
| 9 | IIII IIII I | 11 | ≈11.11% |
| 10 | IIII IIII I | 11 | ≈8.33% |
| 11 | IIII | 4 | ≈5.56% |
| 12 | II | 2 | ≈2.78% |
| TOTAL | 100 | 100% |
Figure 1.This chart gives the percentage turnout of every sum that was recorded from the dice roll.
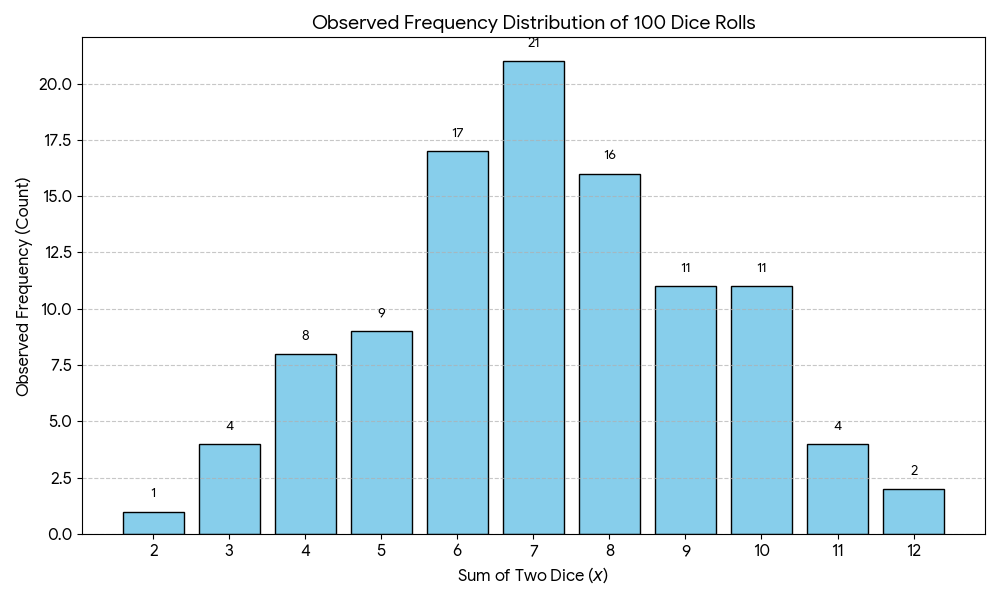
Figure 2. Seven seemed to be the most popular sum in the dice roll, with an 21% , but the sum of 6 and 8 was close as well, with a 16-17% turnout.
For my experiment I have found out that the sum of 12 did not appear at all throughout the experiment and the sum of 2 had the second lowest frequency percentage which was 2%. The sums from lowest occurrence to highest occurrence are as follows: 12, 2, 11 ,3 ,4 ,5 ,9 ,10 ,8 ,6 and 7
Analysis:
Restating my hypothesis, I predicted that the sum of seven would be the most frequent outcome after rolling the dice 100 times. After conducting the experiment, the results strongly supported this claim. The highest concentration of outcomes was found between the sums of 6 and 8. The sum of 7 was recorded 21 times, making it the single most frequent result. The sums of 6 (17 outcomes) and 8 (16 outcomes) also had very high frequencies. As one can see on the bar chart, these three central sums represent the clear peak of the distribution.
The Theoretical Probability Formula, specifically applied to compound events (like rolling two dice).The reason the sum of 7 is the most popular is because it has the highest number of combinations, by the outcomes of 36 and the formula directly shows this
This observed outcome is strongly supported by the principles of theoretical probability, as explained by resources like Khan Academy “Probability: the basics (article)”. The fundamental formula for probability demonstrates why the number 7 must be the most probable sum
Percentage Formula
With two dice, the total number of outcomes is 36. Khan Academy shows that the sum of 7 has the highest number of favorable outcomes (6 ways), giving it a probability of 6/36 (or 1/6). Conversely, the least common sums, 2 and 12, each only have 1 favorable outcome, giving them a probability of 1/36. The formula clearly expresses that 1/6 is much greater than 1/36, which explains why my experiment showed a much higher turnout rate for 7 than for 2 and 12. The experimental data, particularly the way the smaller sum frequencies build up to 7, is directly consistent with this mathematical theory.
Conclusion
The objective of this dice probability experiment to determine the most frequent sum resulting from 100 rolls of a pair of dice was successfully met. The results provided strong empirical evidence supporting the initial hypothesis.The experiment confirmed that the sum of seven was indeed the most frequently occurring outcome, recorded 21 times out of the 100 trials. Furthermore, the overall distribution of the observed frequencies aligned precisely with the established theoretical model, forming the expected bell-shaped curve centered around the highest probability sums (6, 7, and 8). The low frequency of the extreme sums (2 and 12) further validated this theoretical expectation. Now I know that the number 7 will give the best odds in winning at the casino.
Appendix :
| Roll # | Sum | Roll # | Sum | Roll # | Sum | Roll # | Sum |
| 1 | 8 | 26 | 5 | 51 | 9 | 76 | 6 |
| 2 | 7 | 27 | 6 | 52 | 8 | 77 | 7 |
| 3 | 5 | 28 | 7 | 53 | 10 | 78 | 5 |
| 4 | 7 | 29 | 11 | 54 | 7 | 79 | 9 |
| 5 | 6 | 30 | 7 | 55 | 7 | 80 | 10 |
| 6 | 7 | 31 | 5 | 56 | 6 | 81 | 7 |
| 7 | 8 | 32 | 9 | 57 | 8 | 82 | 4 |
| 8 | 10 | 33 | 4 | 58 | 5 | 83 | 6 |
| 9 | 4 | 34 | 6 | 59 | 7 | 84 | 8 |
| 10 | 9 | 35 | 8 | 60 | 6 | 85 | 11 |
| 11 | 7 | 36 | 12 | 61 | 9 | 86 | 6 |
| 12 | 6 | 37 | 7 | 62 | 8 | 87 | 5 |
| 13 | 11 | 38 | 6 | 63 | 7 | 88 | 7 |
| 14 | 8 | 39 | 9 | 64 | 6 | 89 | 8 |
| 15 | 7 | 40 | 8 | 65 | 7 | 90 | 7 |
| 16 | 5 | 41 | 10 | 66 | 10 | 91 | 8 |
| 17 | 4 | 42 | 5 | 67 | 8 | 92 | 6 |
| 18 | 9 | 43 | 7 | 68 | 5 | 93 | 7 |
| 19 | 6 | 44 | 7 | 69 | 3 | 94 | 4 |
| 20 | 8 | 45 | 3 | 70 | 8 | 95 | 8 |
| 21 | 7 | 46 | 6 | 71 | 7 | 96 | 9 |
| 22 | 8 | 47 | 8 | 72 | 9 | 97 | 5 |
| 23 | 5 | 48 | 11 | 73 | 7 | 98 | 7 |
| 24 | 9 | 49 | 4 | 74 | 8 | 99 | 3 |
| 25 | 12 | 50 | 7 | 75 | 6 | 100 | 7 |
Reference List Entry(APA):
- Khan Academy. (n.d.). Probability: The basics. Khan Academy. https://www.khanacademy.org/math/statistics-probability/probability-library/basic-theoretical-probability/a/probability-the-basics
- Lukac, S., & Engel, R. (n.d). Investigation of probability distributions using dice rolling simulation . pg 33 para 1-5. https://research-ebsco-com.ccny-proxy1.libr.ccny.cuny.edu/c/7o7b7t/viewer/pdf/cgpylonzuz?route=details
- Yucemoz, M. (n.d.). Influence of the scalar physical quantity field on the probability of an outcome. Retrieved from https://essopenarchive.org/doi/full/10.1002/essoar.10505840.1
- The Math Sorcerer. (2019, October 13). Probability of a sum of six when rolling two dice Video. YouTube. https://www.youtube.com/watch?v=ErDi68j06qA (0.01-1.00 minute )

